

The Bullish Tweezer Bottom candlestick pattern is a popular reversal signal used by traders in stock markets, forex, and cryptocurrency trading. This pattern helps traders identify a potential trend reversal from a downtrend to an uptrend.
Technical traders rely on candlestick patterns to understand market psychology, and the Tweezer Bottom is considered one of the strong short-term bullish reversal patterns. In this article, we will explain the Tweezer Bottom candlestick pattern, examples, trading strategy, PDF guide, and meaning in Hindi.
What is a Bullish Tweezer Bottom Candlestick Pattern?
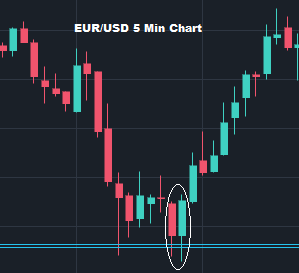
The Bullish Tweezer Bottom is a two-candlestick reversal pattern that appears at the end of a downtrend. It signals that selling pressure is weakening and buyers may soon take control of the market.
This pattern forms when two consecutive candles have almost the same low price, creating a support level.
Structure of the Pattern
- First Candle
- Usually a bearish (red) candle
- Shows strong selling pressure
- Second Candle
- Usually a bullish (green) candle
- The low price is almost the same as the first candle
- Indicates buyers are entering the market
This matching low creates the “tweezer” shape, which is why it is called the Tweezer Bottom pattern.
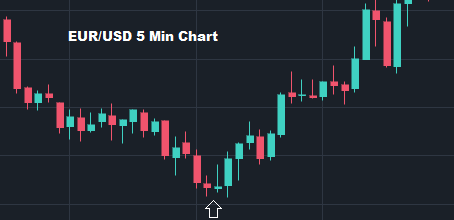
Tweezer Bottom Candlestick Pattern Example
Let’s understand the pattern with a simple example.
Imagine a stock that has been falling for several days.
Day 1:
- Price opens at ₹100
- Falls to ₹92
- Closes at ₹94
Day 2:
- Price again falls to ₹92
- Buyers enter the market
- Price rises and closes at ₹98
Here both candles touch the same low (₹92). This shows that the market has found strong support, which may lead to a bullish reversal.
Traders often enter a buy trade after confirmation from the next bullish candle.
How to Trade the Bullish Tweezer Bottom Pattern
Traders use this pattern to identify buying opportunities.
Entry Point
Enter the trade when the next candle breaks above the high of the second candle.
Stop Loss
Place the stop loss below the lowest point of the pattern.
Target
Targets can be set using:
- Previous resistance levels
- Risk-reward ratio (1:2 or 1:3)
- Moving averages or Fibonacci levels
Best Timeframes
The pattern works well on:
- 15-minute charts
- 1-hour charts
- Daily charts
Higher timeframes usually give more reliable signals.
You may Like
- Bearish Engulfing Pattern Trading Strategy Guide (Complete 2026 Guide)
- Bullish Tweezer Bottom Candlestick Pattern – Meaning, Example, PDF & Hindi Guide
- Fibonacci Retracement: How to Draw It in Uptrend for Reversal & Intraday Trading
- Fibonacci Retracement: How to Draw It in Uptrend for Reversal & Intraday Trading
- How To Identify Bearish Harami Candlestick Pattern
- Bearish Evening Star Candlestick Pattern: Meaning, Identification & Trading Guide
- Shooting Star Candlestick Pattern: Bullish or Bearish? Complete Guide
- How to Trade the Hanging Man Candlestick Pattern (Bearish & Red Hanging Man Explained)
Importance of Volume in Tweezer Bottom
Volume plays an important role in confirming the pattern.
If the second bullish candle has higher volume, it shows strong buying interest. This increases the probability of a successful reversal.
Without volume confirmation, the signal may be weaker.
Advantages of the Tweezer Bottom Pattern
Here are some key benefits of using this pattern:
✔ Easy to identify on charts
✔ Works in stocks, forex, and crypto markets
✔ Helps identify strong support levels
✔ Useful for short-term and intraday trading
Limitations of the Pattern
Although useful, traders should not rely on this pattern alone.
Some limitations include:
- False signals in sideways markets
- Requires confirmation from other indicators
- Less reliable on very small timeframes like 1-minute charts
Professional traders usually combine it with:
- Support and resistance
- Trendlines
- RSI indicator
- Moving averages
Tips for Using the Tweezer Bottom Pattern
To improve your trading accuracy, follow these tips:
- Always check if the pattern forms after a clear downtrend.
- Look for strong support zones.
- Wait for confirmation candle before entering.
- Combine with indicators like RSI or Moving Average.
- Manage risk with proper stop-loss placement.
Tweezer Bottom Candlestick Pattern in Hindi
ट्वीजर बॉटम कैंडलस्टिक पैटर्न एक बुलिश रिवर्सल पैटर्न है जो डाउनट्रेंड के अंत में बनता है।
इस पैटर्न में दो कैंडल होती हैं जिनका लो लगभग समान होता है।
पहली कैंडल:
- लाल (Bearish) होती है
- बाजार में सेलिंग प्रेशर दिखाती है
दूसरी कैंडल:
- हरी (Bullish) होती है
- खरीदारों की एंट्री दिखाती है
जब दोनों कैंडल का लो एक जैसा होता है, तो यह संकेत देता है कि बाजार में मजबूत सपोर्ट बन गया है और कीमत ऊपर जा सकती है।
- Bearish Engulfing Pattern Trading Strategy Guide (Complete 2026 Guide)
- Bullish Tweezer Bottom Candlestick Pattern – Meaning, Example, PDF & Hindi Guide
- Fibonacci Retracement: How to Draw It in Uptrend for Reversal & Intraday Trading
- How To Identify Bearish Harami Candlestick Pattern
- Bearish Evening Star Candlestick Pattern: Meaning, Identification & Trading Guide
Q1. Is a tweezer top bullish or bearish?
Why It Is Bearish
The Tweezer Top appears at the end of an uptrend and signals that the market may reverse downward.
Structure of the Pattern
It consists of two candles:
First Candle – Usually bullish (green) showing strong buying.
Second Candle – Usually bearish (red) with a high price almost equal to the first candle’s high.
This means the market tried to go higher twice but failed, showing strong resistance.
What It Indicates
Buyers push the price up first.
Sellers enter at the same high level.
The price may reverse and move downward.
✅ Conclusion:
Tweezer Top → Bearish reversal signal
Tweezer Bottom → Bullish reversal signal
")


")


