

The bullish hammer candlestick pattern is one of the most trusted single-candle reversal signals in technical analysis. Traders use it to spot potential trend reversals, especially after a strong downtrend. If understood correctly, it can help you identify high-probability buying opportunities in stocks, forex, crypto, and commodities.
What Is a Bullish Hammer Candlestick?
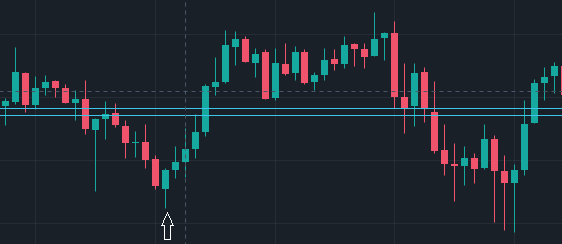
A bullish hammer is a single candlestick that appears after a downtrend and signals that selling pressure may be ending. It has a small real body at the top and a long lower wick (shadow), showing that buyers stepped in strongly after sellers pushed the price down.
Key Characteristics
- A small real body near the top of the candle
- A long lower shadow (at least 2x the body size)
- Little to no upper shadow
- Appears after a downtrend
- Shows buying pressure overcoming sellers
Why Does a Bullish Hammer Form? (Candle Psychology)
The psychology behind this pattern is what makes it powerful:
- Market opens → sellers dominate
Price drops sharply as bears continue the downtrend. - Low point → buyers enter aggressively
Bulls absorb the selling pressure and push price up. - Market closes near the open
This shows that buyers have regained control.
This shift from seller dominance to buyer strength indicates a possible trend reversal.
How to Identify a Strong Bullish Hammer
A hammer is more reliable when:
1. It Forms After a Strong Downtrend
A hammer appearing in a sideways market is not effective.
2. The Lower Wick Is Very Long
The longer the wick, the stronger the buyer rejection of lower prices.
3. Volume Increases on the Hammer Candle
High volume shows serious buying interest.
4. The Next Candle Confirms the Reversal
A strong bullish candle after the hammer increases reliability.
How to Trade the Bullish Hammer Candlestick Pattern
1. Wait for Confirmation
Never enter immediately after seeing a hammer.
Wait for a bullish close above the hammer’s high.
2. Entry Point
Buy when the next candle breaks the high of the hammer.
3. Stop-Loss Placement
Put a stop-loss below the low of the hammer wick
This protects you because if price breaks below, the pattern fails.
4. Take-Profit Targets
- Target 1:1 or 1:2 risk-to-reward ratio
- Next resistance zone
- Or follow your trend indicators (EMA, RSI, MACD)
Examples of Where Bullish Hammers Work Well
- At major support zones
- After a long red candle series
- Near trendline support
- Around Fibonacci levels
- After oversold readings in RSI
Bullish Hammer vs. Shooting Star (Don’t Confuse Them!)
| Pattern | Trend | Wick | Meaning |
| Bullish Hammer | Downtrend | Long lower wick | Bullish reversal |
| Shooting Star | Uptrend | Long upper wick | Bearish reversal |
How Reliable Is the Bullish Hammer Pattern?
According to bulk candlestick studies by market research analysts, the bullish hammer has a 55–60% success rate when traded with confirmation and proper risk management.
It becomes even more reliable when combined with:
- Support levels
- Trendlines
- Volume signals
- EMA 5, 20 or 21 (as many intraday traders prefer)
Conclusion
The bullish hammer candlestick pattern is a simple but powerful tool for spotting potential reversals after a downtrend. When combined with confirmation and good risk-reward management, it can help traders catch early trend reversals with confidence.
Whether you trade stocks, crypto, forex, or indices, the hammer is one pattern every trader should understand.
Also Read
How to Trade the Hanging Man Candlestick Pattern (Bearish & Red Hanging Man Explained)
How to Trade in a Symmetrical Chart Pattern
- Bullish Tweezer Bottom Candlestick Pattern – Meaning, Example, PDF & Hindi Guide
- Fibonacci Retracement: How to Draw It in Uptrend for Reversal & Intraday Trading
- How To Identify Bearish Harami Candlestick Pattern
- Bearish Evening Star Candlestick Pattern: Meaning, Identification & Trading Guide
- Shooting Star Candlestick Pattern: Bullish or Bearish? Complete Guide
Q1. From where I can download the Hammer candlestick pattern PDF?
Ans You can download the Hammer candlestick pattern PDF from our website.
Q2. Hammer candlestick pattern 5 minutes
Ans Hammer Candlestick (5-Minute) – In Short
1. Bullish reversal signal
2. Appears after a fall
3. Long lower wick, small body on top
4. Buy only after next candle breaks hammer high
5. Stop-loss below hammer low
6. Best near support or with good volume


